


However, most often the equipment records data in a time domain or acceleration vs. time dependence. To transform a function of time into a function of frequency, we use a mathematical technique called Fourier Transform.
Modern vibration controllers are digital and their ADC/DAC performs Discrete Fourier Transform (DFT) or Fast Fourier Transform (FFT). The only difference between these two transformation types lies in the speed of the algorithm: in FFT, calculations are optimized for an N-number of samples, where N is a multiple of 2:

Vibration analysis usually only operates with a modulus of FFT ( ) — frequency response function part of the calculated result, or FRF.
Fast Fourier Transform (FFT) is an essential tool in the field of vibration testing and data analysis. Here are some of its uses:
- Structural Analysis: FFT can be used to identify the natural frequencies or resonant frequencies of structures, most notably with Sine vibration testing. If a structure is excited at its resonant frequency, it can undergo damaging levels of vibration. Identifying these frequencies allows engineers to design structures and systems to avoid these conditions.
- Machine Health Monitoring: FFT is used in predictive maintenance to monitor the condition of machinery. Changes in the vibration spectrum can indicate issues such as misalignment, imbalance, or bearing wear. By monitoring these changes, maintenance can be performed before a failure occurs.
- Modal Analysis: In modal analysis, FFT is used to identify the mode shapes and natural frequencies of a structure. This information is important in the design of structures to ensure they can withstand the forces they will be subjected to.
- Shock Analysis: FFT can be used to analyze the frequency content of shock events. This is important in packaging design, to ensure that products can withstand the shocks they may experience during shipping.
- Noise Analysis: FFT can be used to analyze noise vibrations and identify their sources. This can be important in industries such as automotive or aerospace, where noise reduction is a key design criterion.
In all these applications, the speed and efficiency of the FFT algorithm make it possible to perform complex analyses in real-time or near real-time, which can be critical in many industrial applications.
FFT serves as a foundation for the calculations made in the Random test. We’ve covered this particular method of vibration testing in our article.
In RULA software, you can display vibration testing data using a variety of graphs in frequency and time domains — all necessary calculations are done automatically.
Now let us take a more detailed look at the process of Fourier Transform. As you can see from the formula, the Fourier Transform decomposes any input signal into harmonic parts. The result is a conversion of usual acceleration vs. time dependence into acceleration vs. frequency dependence. Such data representation is known as the frequency domain.
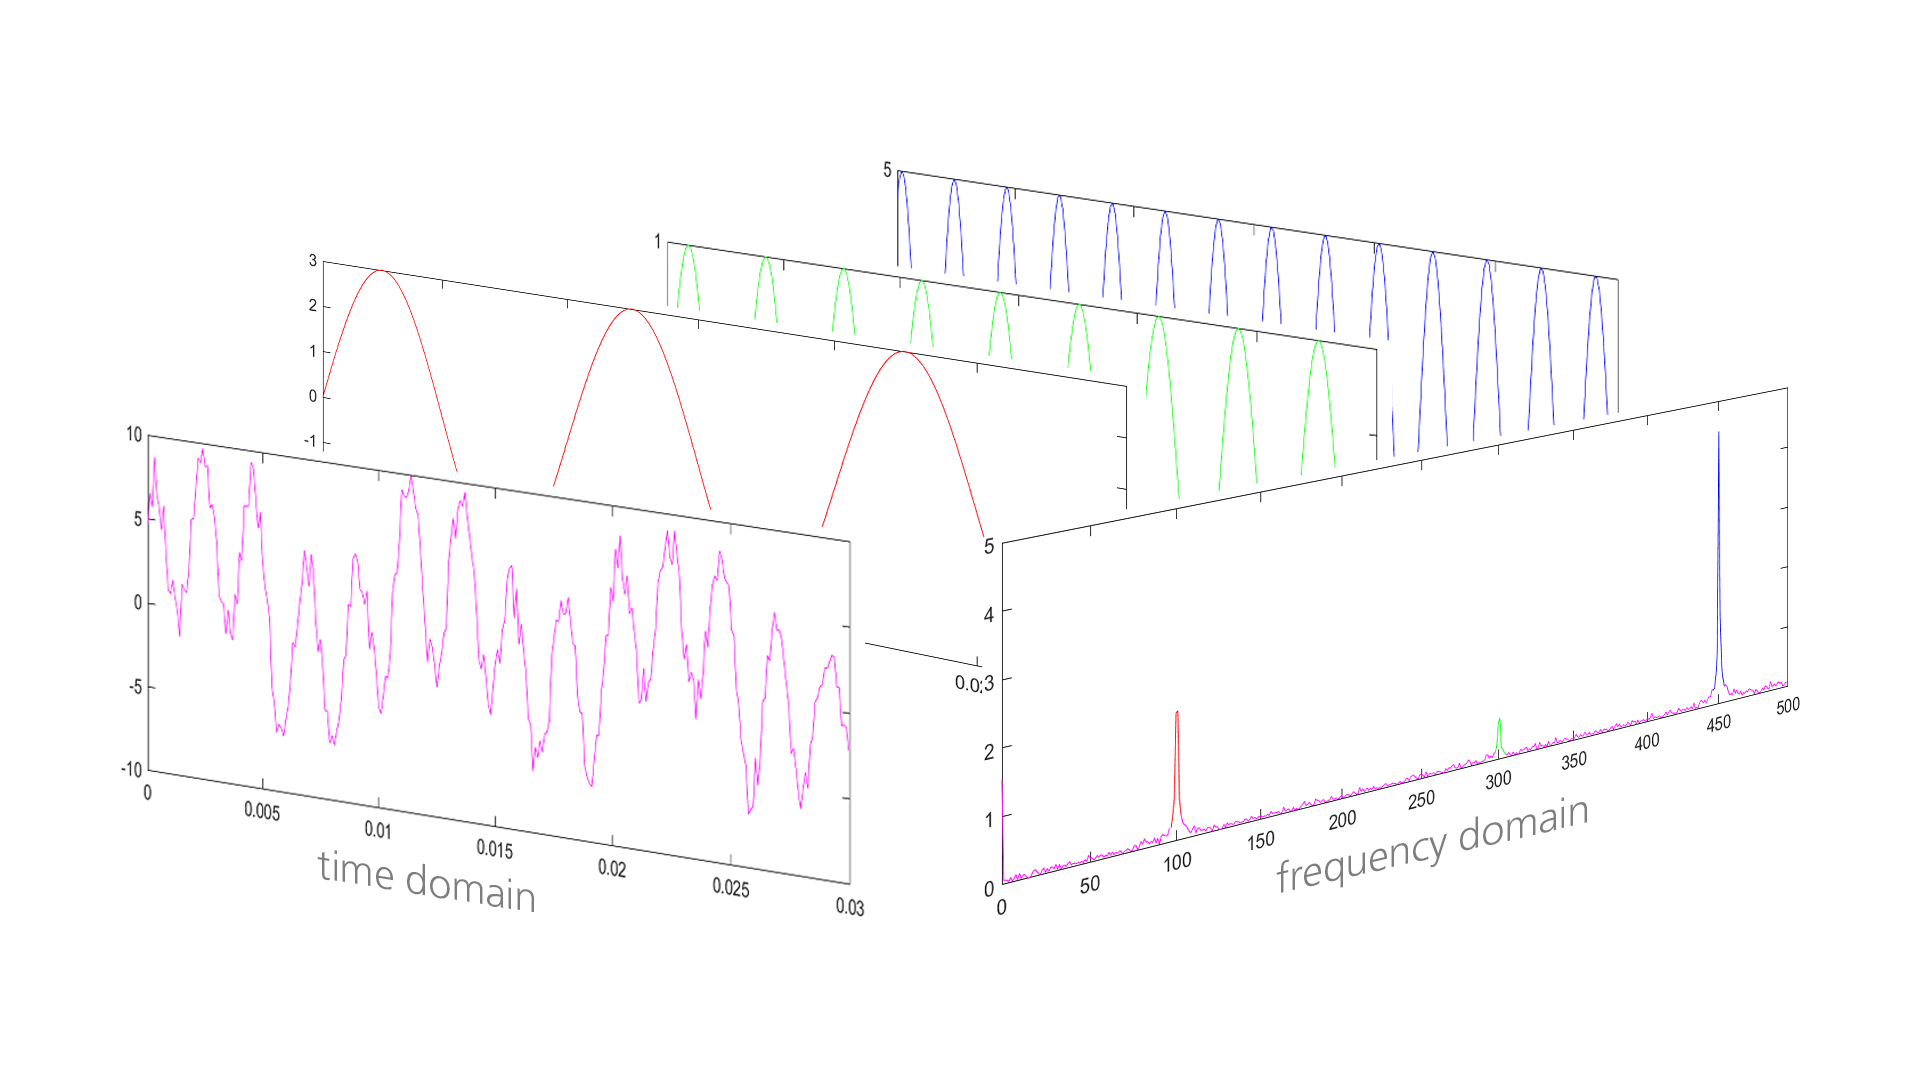
It is easy to illustrate the Fourier Transform on the example of sound waves. For example, when a guitar is playing, each string vibrates at its natural (resonant) frequency, and the music we hear is the result of all these oscillations added together. Fourier Transform allows us to display each of the frequency harmonics separately. The principle is the same for mechanical vibration – we can observe one or many harmonics on different frequencies depending on the test type.

Let us also consider some of the key parameters used in FFT calculation. The first one is the sample rate (Fs). The parameter is not part of the formula, but the frequency range available after FT calculation is limited by half the sample rate according to Nyquist theorem
Another important parameter is window length or the total number of samples (N). This characteristic defines the frequency measurement step, as the entire 0-Fs frequency range is divided into N-steps with the measurement step calculated as 
When we analyze vibration, the data in the frequency domain can be represented in the form of PSD (Power Spectral Density), RMS or amplitude vs. frequency, on logarithmic or linear scale. This format of data display helps to analyze frequency characteristics of the system or quickly and easily find a resonance.