


An option included in the RULA Software package allows us to represent vibration impact in such a way that it would reduce test duration by several times. This type of test is called Fatigue Damage Spectrum, or FDS.
What is Fatigue?
Fatigue is an accumulation of damage caused by stress, which, in turn, is the result of vibration. The accumulation of damage changes the properties of the object causes the appearance of cracks, and, eventually, destroys the object. The ability of the object to withstand stress is called durability.
When we deal with a prolonged vibration impact, durability is characterized by S/N curve (Stress(S) to cycles(N), or Wöhler-curve).
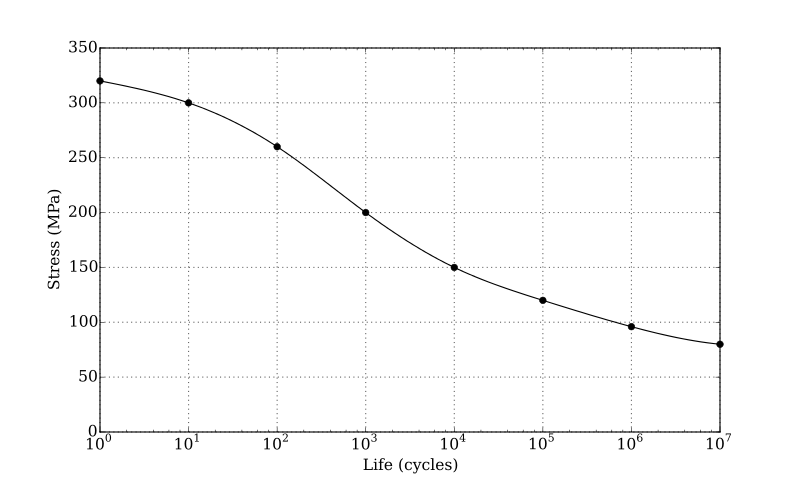
Figure 1- An S/N curve
Let’s look at an example. If we have an iron ruler, the S/N curve shows, how many times we can band the ruler with a certain amplitude before it breaks.
The Palmgren-Miner rule states:
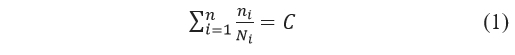
where
- n – number of cycles with i-level of stress;
- N – number of cycles needed to destroy the object;
- С – number, which characterizes the accumulated fatigue.
When C gets the value of 1 or more, the object breaks.
Let us assume that the ruler will break, if it is bent 1000 times with an amplitude of 10 mm, or 10000 times with an amplitude of 1 mm.
In FDS software module in RL-C21, the ruler was subject to 5000 cycles of stress with 1-mm amplitude and 470 cycles with 10-mm amplitude.
Thus, the total damage can be calculated as follows:

Therefore, the ruler has exhausted 97% of its durability and is likely to break after another 30 stress cycles of 10-mm amplitude or 300 stress cycles with 1-mm amplitude.
What is Fatigue Damage Spectrum?
The fatigue damage spectrum shows the damage done to the object under test by a particular signal frequency. If PSD is the distribution of energy by frequencies, FDS is the distribution of damage by frequencies.
Such spectrum is calculated by the same principle as SRS (Shock Response Spectrum): we take a number of spring-mass systems, each with its own natural frequency. The systems should have the same damping factor.
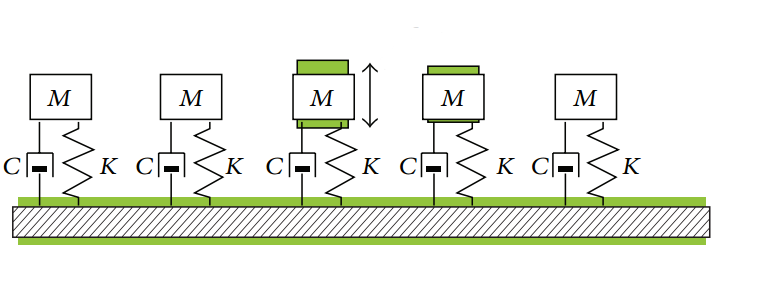
Figure 2 – Spring-mass systems
A certain signal affects the spring-mass systems, and calculate the damage level, using the Palmgren-Miner rule – i.e., count the number of fluctuations certain with a certain amplitude for each of the mass-spring systems, and then calculate the damage by the slope of the S/N curve.
In other words, to perform an FDS-test, we need to calculate fatigue damage based on the recorded data, and then synthesize a signal, which would produce the same damage in a shorter time.
How is FDS Calculated?
Stress is directly proportional to velocity with the P-coefficient.
Based on this fact, the following algorithm is used to calculate the spectrum:
- Calculating velocity;
- Calculating the number of cycles and their amplitudes;
- Calculating damage
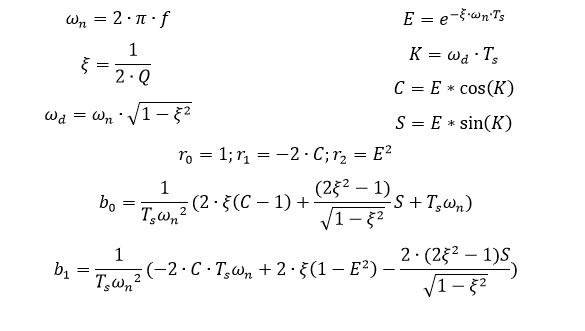
How is Velocity Calculated?
We can obtain the velocity of a spring-mass system by filtering the signal with an IIR-filter.
The filter coefficients are calculated using a formula:
- f – spring-mass system natural frequency;
- Q – Q-factor;
- Ts – sample rate;
- vk – k-th velocity sample;
- аk – k-th acceleration sample;
Velocity is calculated using the formula:

Calculating the Number of Cycles
After velocity is calculated, we need to find stress, i.e., determine all fluctuation cycles and calculate the amplitude of each.
This is done using Rainflow algorithm. RULA Technologies applies the realization of this algorithm from WAFO toolbox (Wave Analysis for Fatigue and Oceanography).

b / c — constants, characterizing the S/N-curve.
How is the Profile Synthesized?
At this step, we perform the reverse task and calculate the signal, which would cause the same damage, based on the calculated FDS.
The damage needs to be calculated analytically; otherwise, the profile selection may take a long time. It is possible to synthesize two types of signals – a Sine and a Random signal, but, as we want to reduce test time, it is preferable to go with the Random signal.
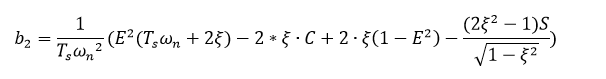
The formula of calculating PSD from FDS is the following:

However, with random signal, the spring-mass system gets excited not only by one component of the frequency, but with the neighboring components as well. So, after obtaining PSD, calculating FDS from PSD becomes an iterative process of correcting PSD, until FDS accurately matches the task profile.
FDS Test Interface
In the example below FDS test was run on RL-C25 vibration control system. We had made recordings on RL-R19 and opened them in TestUp FDS module beforehand.
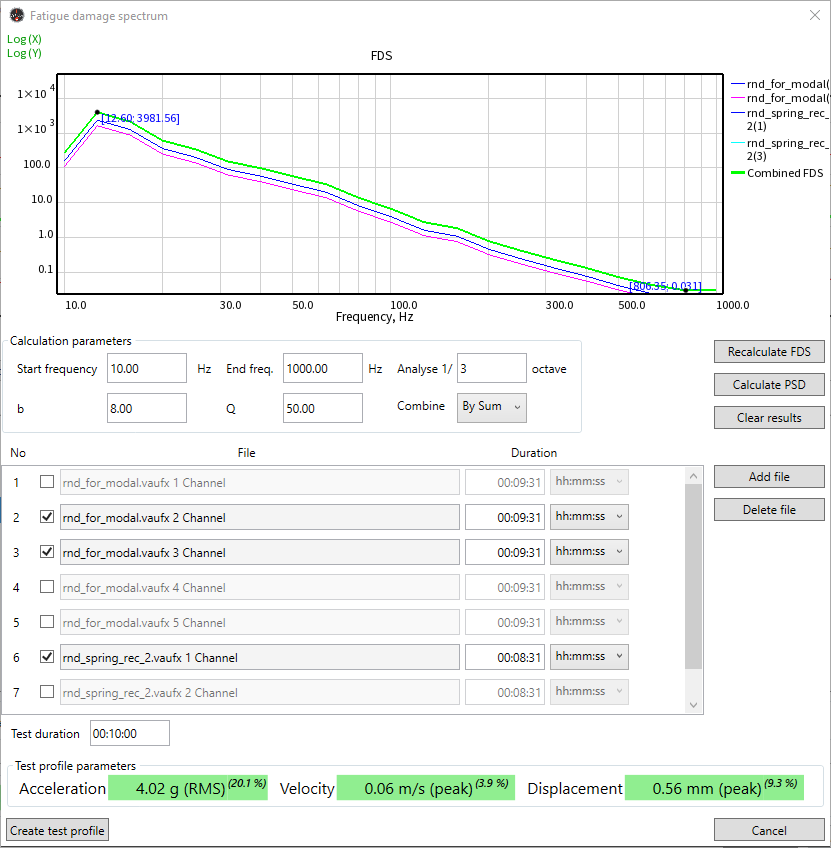
Figure 3 – FDS calculation window in TestUp
After opening the files, we set some essential parameters: start and end analysis frequencies, S/N-slope and Q-factor.
There were a few recordings with real-life data, so they had to be compiled. There are two ways to do so:
- The user can get a sum of spectra of all recordings. Using this method they can imitate testing the objects in all modes consecutively;
- The user can obtain the maximum of frequencies of all spectra in the recordings. This method allows to imitate the “worst case scenario” of the object end-use.
You can specify the duration of impact for every recording, i.e. if we have a 15-minute recording, the program can calculate the spectrum as if it lasted 30 or 60 minutes.
After calculating FDS, we set the desirable test time. The program calculated PSD and displayed the values of acceleration, velocity and displacement. After the calculations, TestUp automatically created a Random test with the preset test time and the calculated PSD-profile.
Conclusion
In conclusion, the FDS software module provides comprehensive test of product durability, with considerably reduced test time and expenses compared to a regular FDR test.
To learn more about our FDS module and get a quotation, write us an email or call +371 6610 2166.