


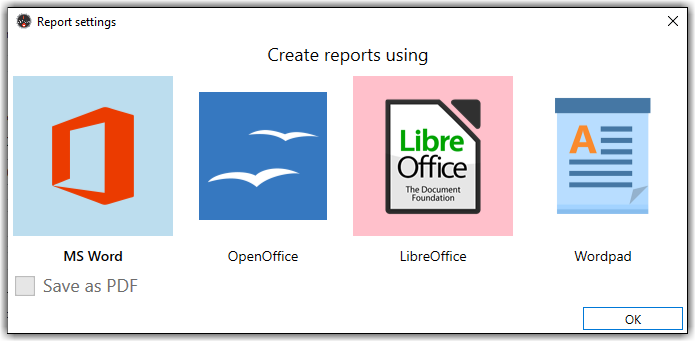
Before you start, set the report settings in TestUp. The first option you need to configure is the default software TestUp SL will use to open the reports. You are offered a choice of 4 apps: MS Office, OpenOffice, LibreOffice, and WordPad. You can also save your report in the .pdf format. Note that you can only choose software installed on your computer — the other options will be disabled.
Attention: MS Office is a paid application and is not included in the TestUp installation pack. TestUp does not support Open Office app versions below 3.2.
TestUp offers you to select a default application for creating and reading reports in the Report settings windows when you first open the app.
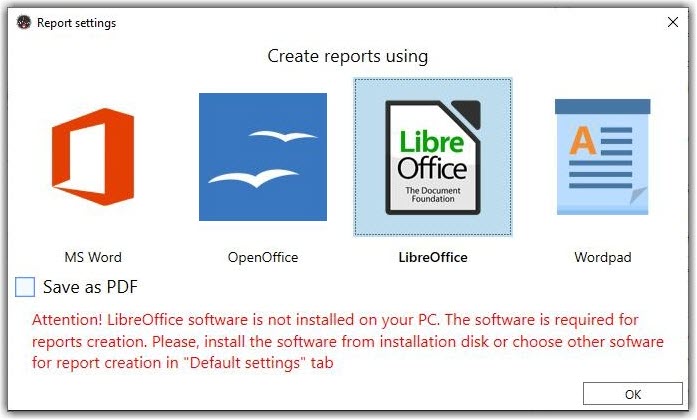
Here is an example of a warning message that will appear if the pack is not installed.
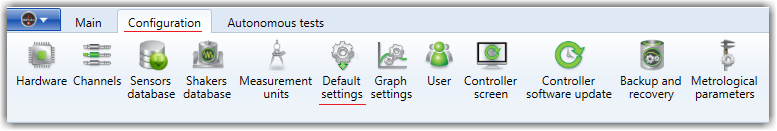
To open the “Report Settings” window, select the “Configuration” tab on the main panel TestUp software and click the “Default settings” button.
After that click the “Report Settings” icon in the “Common tab” of the “Default test settings” window.
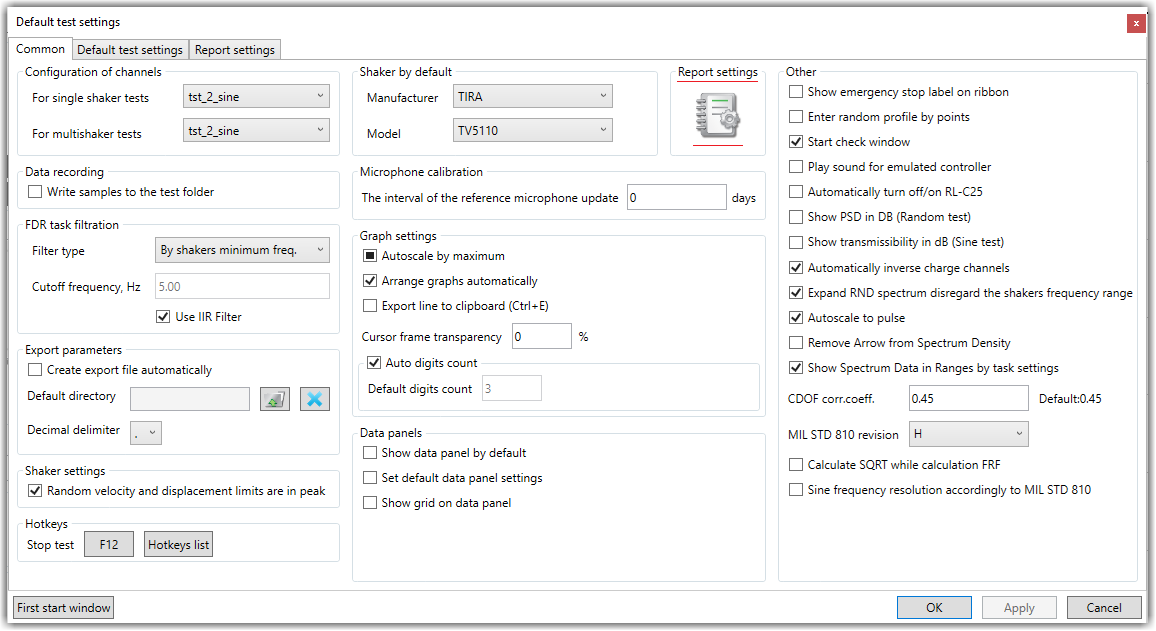
You can also fine-tune your report by clicking the “Report settings” in the “Default test settings” window.
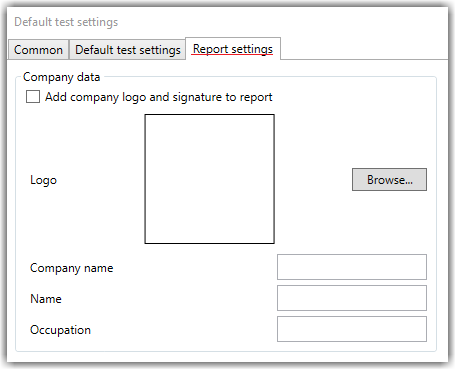
In this configuration tab, you can set your company logo in “.bmp”, “.gif”, “.jpg”, “.jpeg”, and “.gif” formats by clicking the “Browse…” button. Fill in information about company name, worker, and occupation in the relevant fields.
The name of the report file is automatically generated and looks like a string that consists of the test name, current date, and time separated with a “_” delimiter.
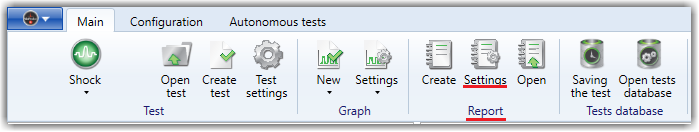
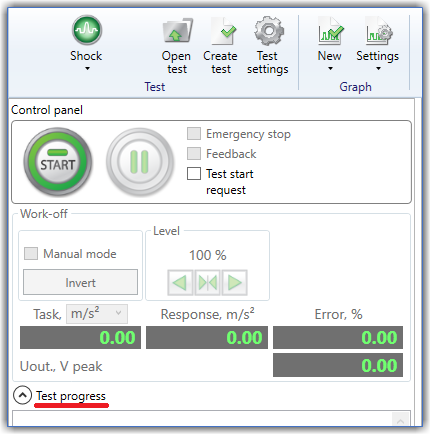
You can set up a separate report for each test type. To configure the report settings for the chosen test, click the “Settings” button in the “Report” group of the main panel…
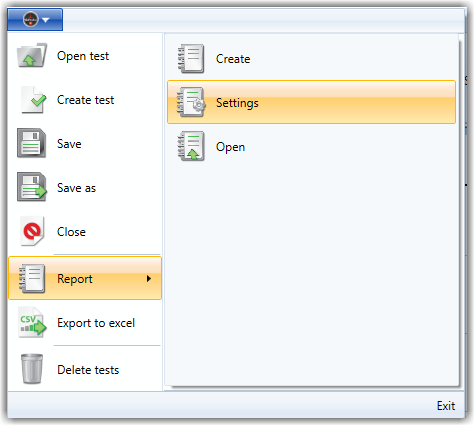
…or select the “Report” item in the main menu of the TestUp .
The “Report settings” window will open.
You can configure the report folder by clicking “Browse” and choosing a directory.
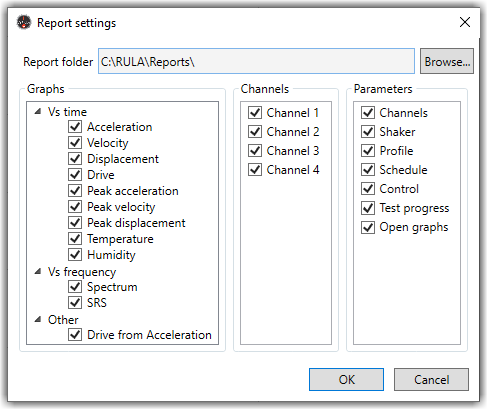
The “Graphs” group settings consist of a list with checkboxes that contain all available graph types for the current test. For example, for Sine, all graphs are selected by default. At least 2 active channels are required for the “Acceleration ratio”, “Acceleration irregularity coefficient” and “Transmissibility” graphs. At least 3 active channels are necessary for the Transverse acceleration coefficient graph. If there are fewer active channels in the test, the corresponding check boxes will not be available.
The “Channels” group settings contain all available active channels which you can add or remove from the graphic. By default, all channels are selected. The screenshot below shows the settings of a default Sine test.
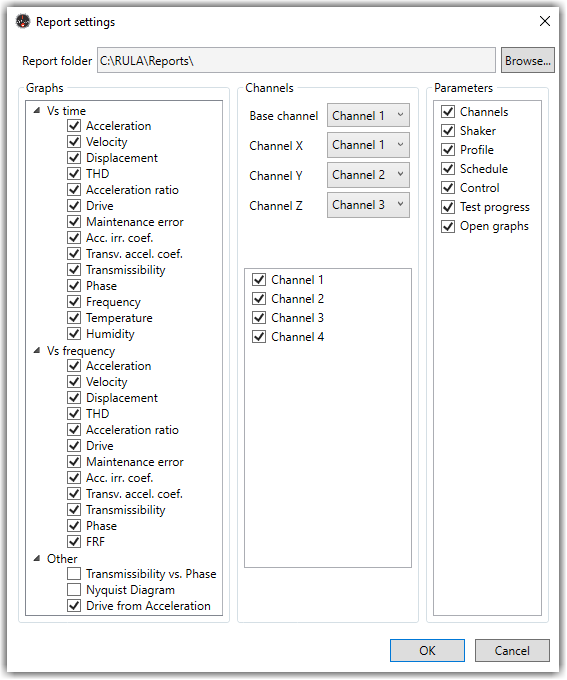
As you can see the “Channels” group has additional parameters such as “Base Channel”, “Channel X”, “Channel Y”, and “Channel Z” displayed in the form of a drop-down list. They are necessary for certain graph types, for example “Acceleration ratio”, “Transverse acceleration coefficient” or “Transverse acceleration coefficient”. By default, the first of the available channels is selected on those lists. If fewer than three channels are active, the “Channel X”, the “Channel Y” and the “Channel Z” drop-down list will not be displayed in the “Channels” report settings group.
The “Parameters” group contains all available parameters you can add or remove for a certain graph:
- “Channels” – add or remove information about active test channels to the report;
- “Shaker” - add or remove the parameters of the shaker to the report;
- “Profile” – add or remove the profile table and the maximum profile values to the report;
- “Schedule” – add or remove the test schedule information to the report;
- “Control” – add or remove the data from the “Control” tab of the test settings to the report;
- “Test progress” – add or remove the list with test log from test control panel;
- “Open graphs” – add or remove all graphs which are open at the moment of the report creation.
By default, all parameters are selected. A Sine test report always includes:
- resonance search and tracking if the schedule has the command “Search for resonance”;
- profile graphs – “Acceleration from frequency”, “Velocity from frequency” and “Displacement from frequency”, on which only the lines “Task”, “Abort” and “Tolerance” are shown.
To save settings in the “Report Settings” window press “OK”.
If you want to open an already formed report click “Open” in the “Report” group on the main panel or open the main menu, select “Report” and click “Open”. Select the report in the dialogue window.
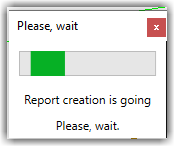
To create a new report, click the “Create” button in the “Report” group on the main panel or open the main menu and select the “Report” item and check “Create”. A progress bar will be shown, and the software will notify you on completion.
If you have any problems with creating a report, contact our 24/7 technical support via email or call +371 6610 2166.