Pierakstīties
Aizpildiet laukus un nosūtiet reģistrācijas pieteikumu. Jūsu pieteikums tiks pārskatīts pēc iespējas ātrāk.
Ja jums jau ir konts, lūdzu, pierakstieties vai atjaunojiet savu paroli.
Pierakstieties
Lai pieteiktos, aizpildiet laukus zemāk.
Un ir laba diena.
Ja jums nav konta, lūdzu, pierakstieties vai atjaunojiet savu paroli
Atjaunot paroli
Lai atiestatītu paroli, aizpildiet zemāk redzamo lauku. Pēc tam jums tiks paziņots e-pastā.
Ja jums nav konta, lūdzu, dziediet vai pierakstieties, ja tāds ir.
Possible applications:
-
Viewing the waveform of the recorded signal;
-
Spectrum graphs: FFT, calculation of spectrum density, RMS or amplitude spectrum;
-
Statistical analysis: calculating RMS, median, minimum and maximum values in the preset fragment of time; calculating the absolute acceleration value on 3 axes; calculating standard deviation;
-
Signal integration and double-integration, calculating the absolute value and sigma-clipping;
-
Arithmetic operations: adding, dividing or multiplying a signal by a signal or a constant, subtracting a signal from a signal or a constant;
-
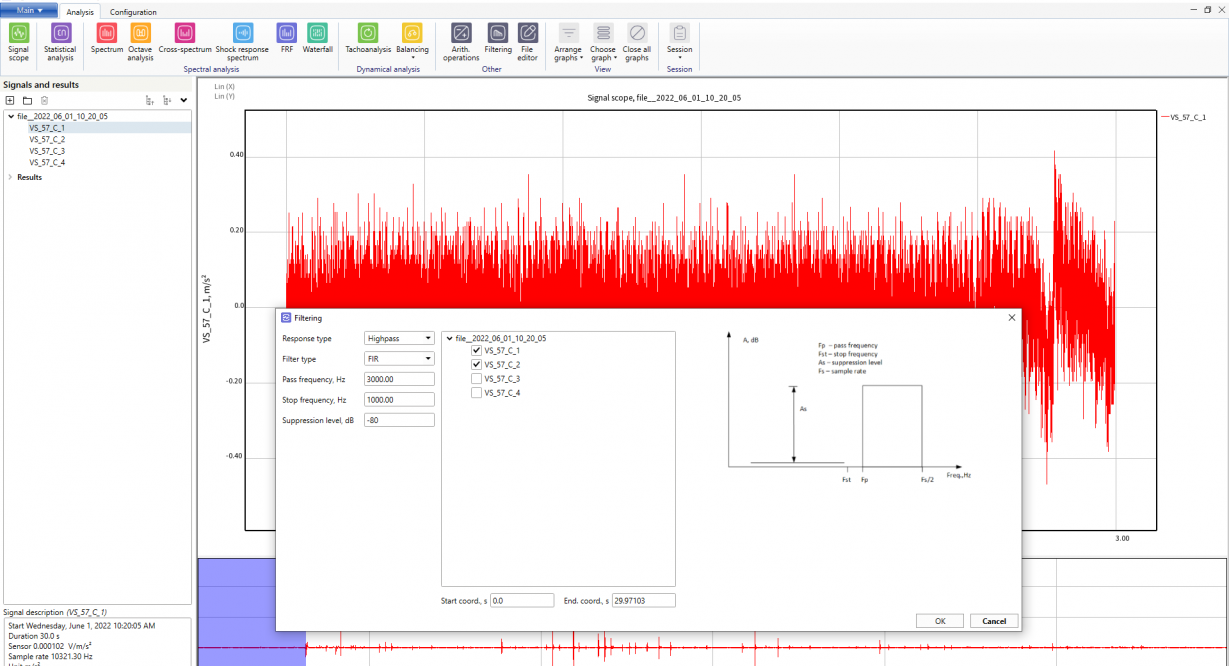
Filtration with FIR or IIR filters. You can specify the filter type: high-pass, low-pass, band-pass, band-stop, and the frequency parameters (cut-off frequencies and attenuation ratio);
-
Shock response spectrum;
-
Waterfall analysis;
-
Data recording;
- Modal analysis.

Data acquisition and analysis
Windows Integration
SignalUp software integrates into any Windows system, starting from Windows 7 and later. To start using the package, simply install the software it using an installation wizard and run the package.
Data Export and Import
SignalUp supports many international file formats, allows you to import data or convert and export the existing files:
- line formats (.txt, .dat, .csv)
- sound files (.wav, .au, .uff, .vauf)
- Matlab files (.mat)
Specifikācija
Data analysis
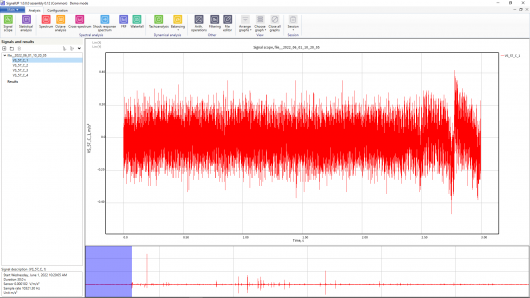
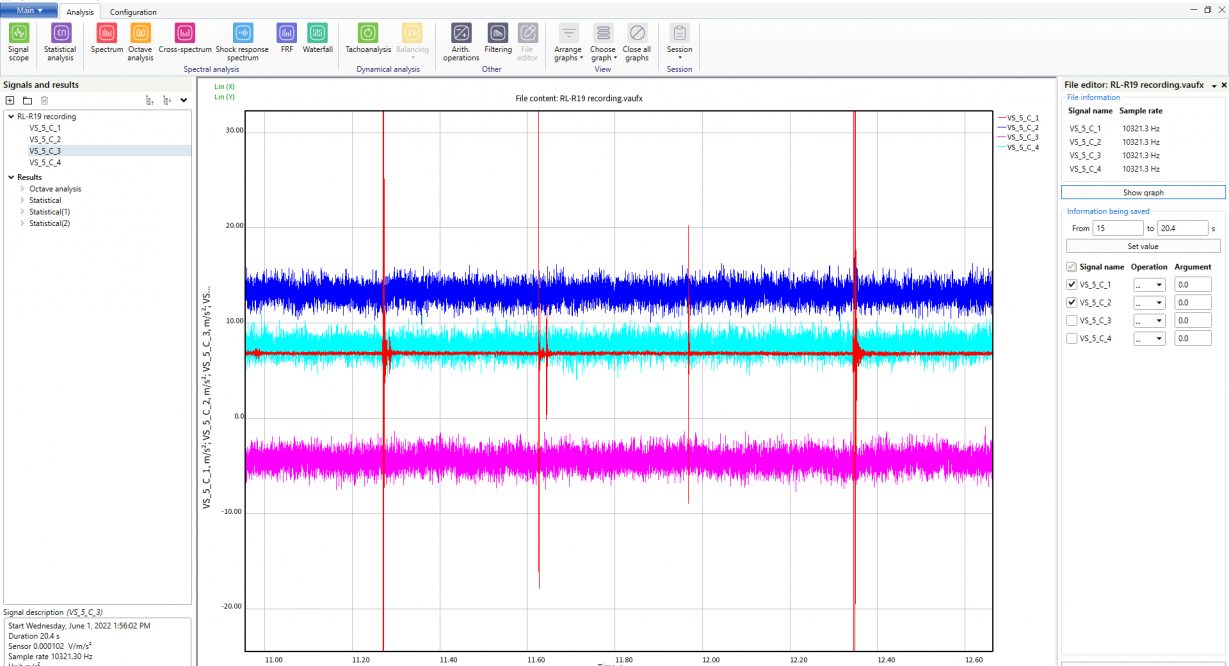
VisAnalyser the user to view files of virtually any length. The whole file or any file fragment can be shown on the graphs.
Choose the file fragment in the special preview area, located at the bottom of the graph window, then move the highlighted zone to quickly display a file fragment at any scale.
To see the numbers, which correspond to the graphical data, you can use special cursors – lines, parallel to Y axis. The coordinate of the intersection with X axis and the value of the signal at the intersection point are shown on each of the cursors. It is also possible to highlight the extreme points on the graphs of any signals.
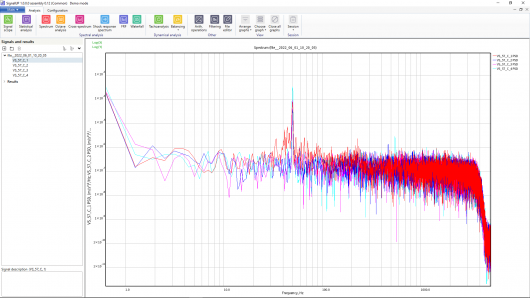
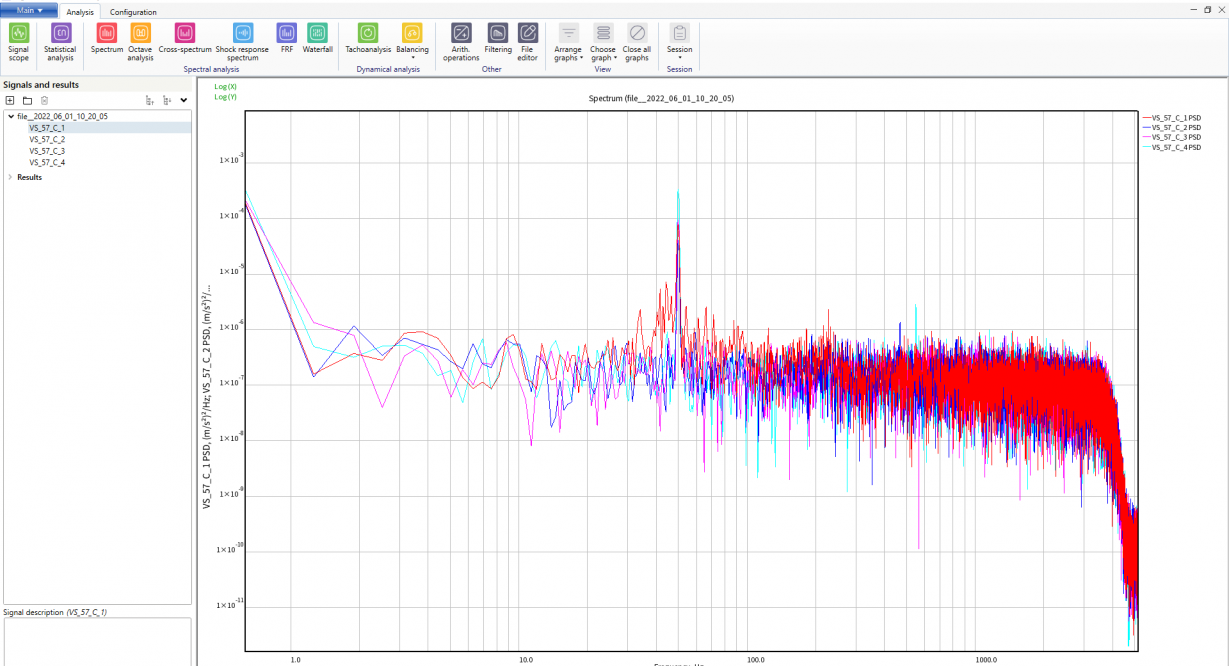
Spectrum Analysis
The user can calculate power spectrum density of the signal, view the RMS and amplitude spectra.Spectrum analysis can be used for vibration diagnostics of machines and mechanisms, finding the source of vibration, finding the differences in the vibration structure of various technical systems.
- For spectrum analysis, you can specify:
- Window length;
- Window function – Hann, Hemming, Blackman, Newtall, flat-top, Kaiser, Bohmann, Chebyshev;
- Averaging type – linear or exponential;
- Zero offset calculation and subtraction;
Part-Octave Analysis
Using part-octave analysis, you can calculate the octave spectrum with the preset octave part from 1/1 to 1/24 based on FFT calculation or IIR-filters. The results of part-octave analysis can be used for vibration diagnostics of machines and mechanisms, calculating the characteristics of acoustic signal, noise level and vibration level.
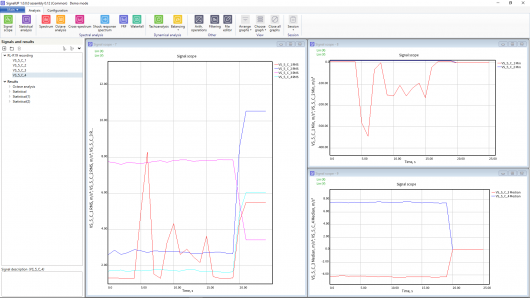
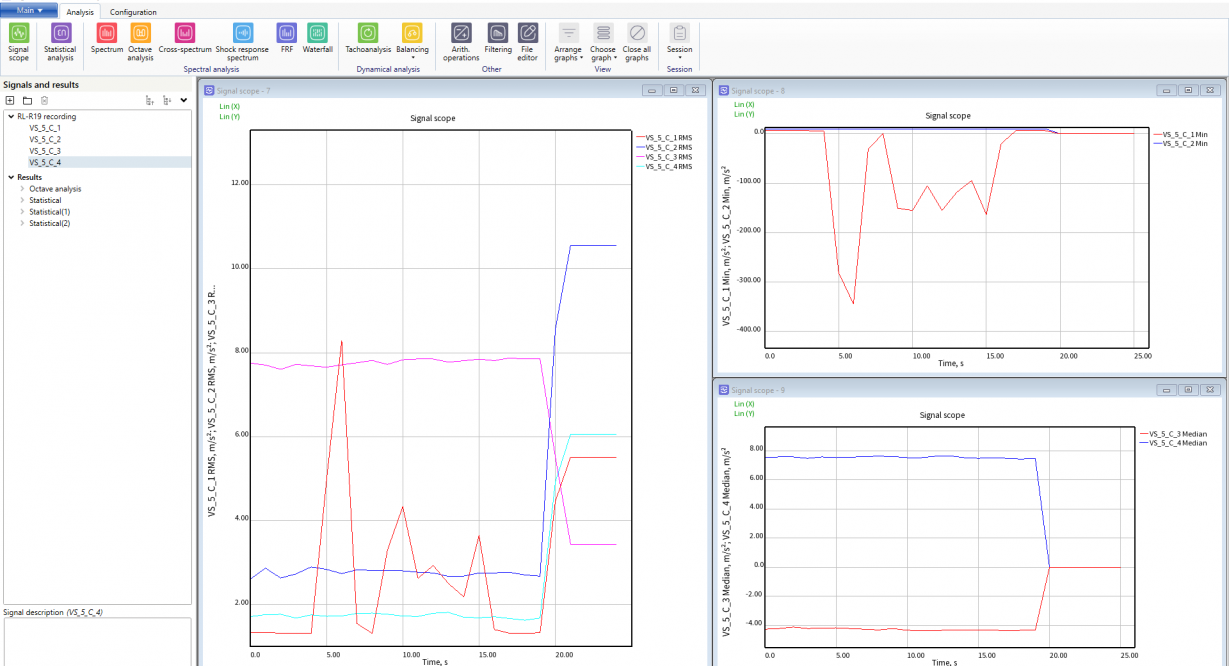
Statistical Analysis
Using statistical analysis, you can obtain various integrated characteristics of the signal, in particular:
- RMS;
- Mean value;
- Minimum value;
- Median value;
- Maximum value;
- Sigma-clipping value.
Besides, with statistical analysis the user can perform integration and double-integration of the signal – i.e. analyze the displacement of the object using the recording of acceleration.
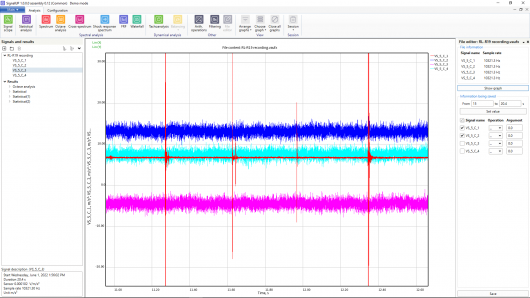
Editing files
In VisAnalyser you can cut the relevant fragment from the data file and then save it as another file for subsequent analysis
Balancing Wizard
A fully functional balancing wizard, which supports one-plane balancing and accepts files of recorded data and values as raw data, makes VisAnalyzer a perfect tool of vibration diagnostics.
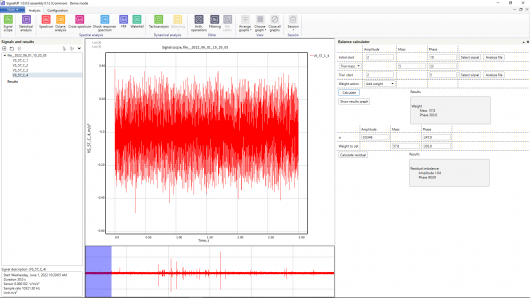
Balancing Calculator
VisAnalyser has an embedded balancing calculator for vibration diagnostics, which helps to calculate the value and position of the corrective weight.
The calculator supports both setting and removing the corrective weight.
Online analysis
Online analysis is the analysis of the data acquired from the analog channels of the acquisition systems in real time. It is possible to analyze data from up to 512 channels from different sources.
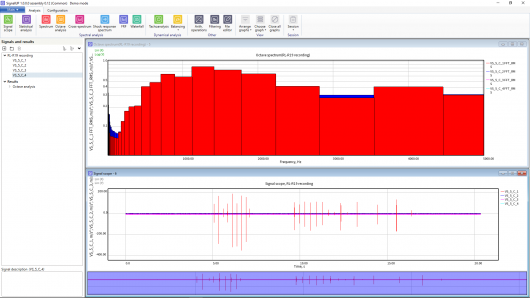
Data Recording
Online analysis mode has an option of data recording. The maximum duration of the recording is only limited by the PC hard drive capacity.
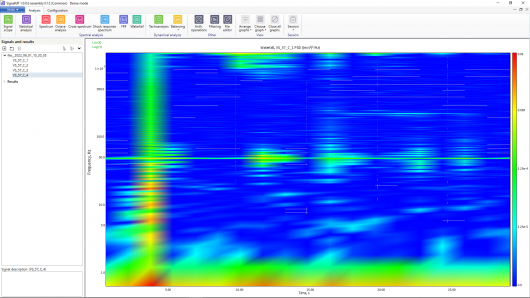
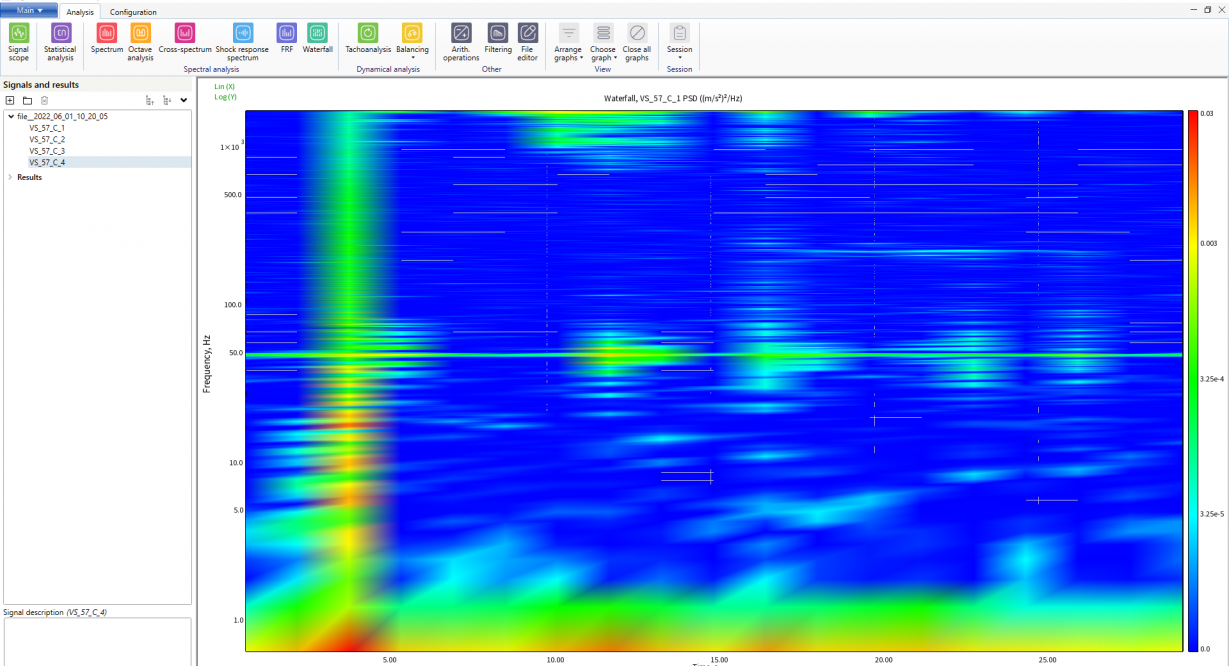
Waterfall Analysis
Waterfall analysis shows the dependency of the signal from frequency and time simultaneously. This type of analysis is used to study the spectrum structure of the signal in time.
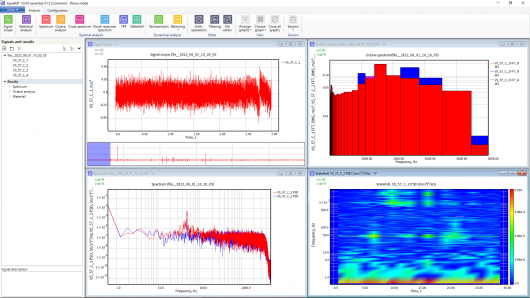
Complex Analysis
The analysis results in the online mode can serve as an input signal for other types of analysis, for example, RMS or spectrum calculation.
Programmas interfeiss
Biežāk uzdotie jautājumi (BUJ)
How do I save the analysis results and the source of data for the analysis?
You can save all the analysis results and data sources using the "Session" menu option. Saving the session guarantees the safety of your data. If you want to get back to this information, you simply have to open the saved session file using the “Session” menu option.
How many sessions can be saved?
The number is not limited.
Informācija Par Produktu
Programmatūras Versijas
-

SignalUp v14 (x86)
-
SignalUp v12 (x86)
-
SignalUp v11 (x86)
-
-
build 05 of 02.12.2018
101.33 MB